NMR of Acetanilide
Contents: [Introduction] [Structure] [H-1 NMR] [C-13 NMR] [Links]
Introduction

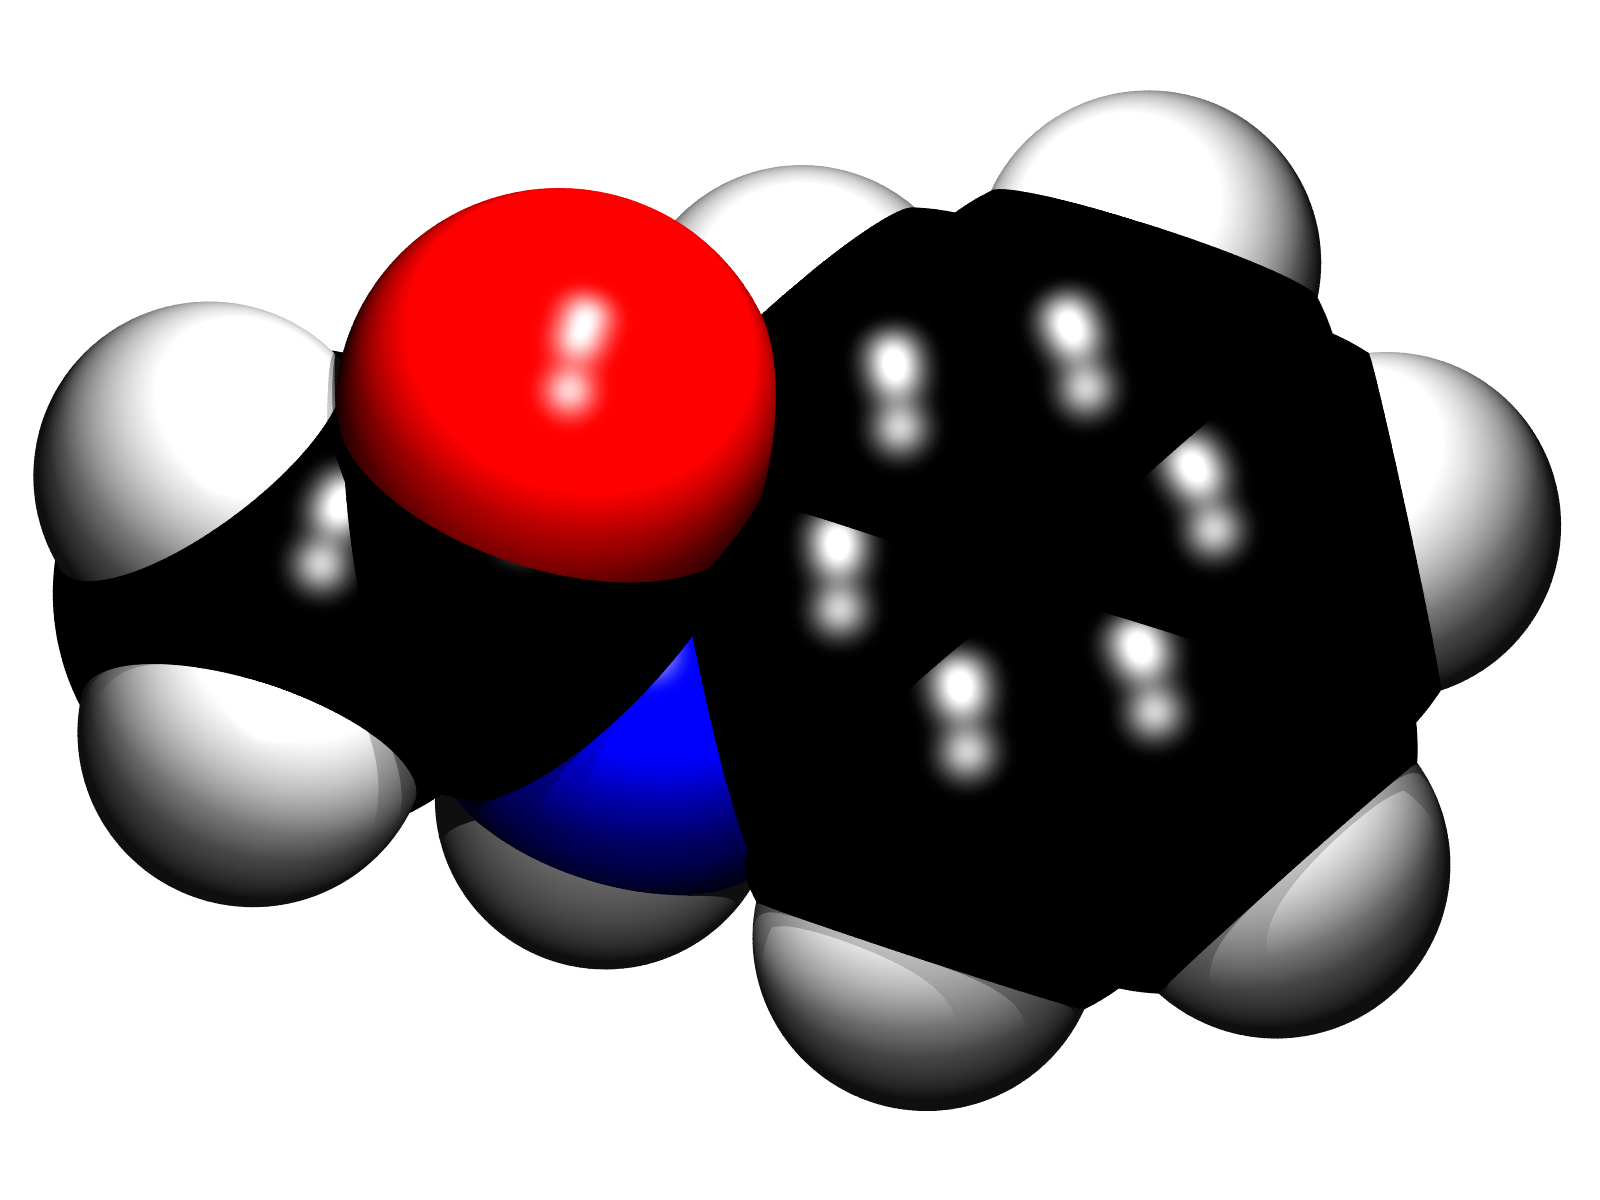
Structure of Acetanilide
If your browser supports or allows JavaScript, you can view and manipulate a molecular view of acetanilide on my Structure of Acetanilide page. Also, there will be more information on the structure of acetanilide. Here, it is sufficient to summarize some key features: In the crystal, acetanilide is basically planar. Molecular modelling suggests that this is true in solution as well. Amides in general may have some additional properties such as E/Z isomers, or even tautomers.
H-1 NMR Spectrum of Acetanilide
Before trying to assign the peaks in the NMR spectra of acetanilide, or any compound, it is useful to develop some expectations, starting from the chemical formula. How many different signal groups do we expect, and what are their intensities. For starters, lets assume that the molecule is as symmetrical as possible, rotation about single bonds should take care of that. This will give us the minimum of signal groups, five in this case: the methyl group (3 Hs), the NH proton (1), the ortho- and meta-protons (2 each), and the single para-proton. For the following NMR spectra, I dissolved just 3.8 mg acetanilide in C6D6 because I wanted a not too concentrated solution with well resolved 1H NMR signals. (Actually, it dissolves not well in C6D6 and it took some convincing --- warming in my hands). The 500 MHz 1H NMR spectrum at 26°C is shown below:

The tallest peak at 7.15 ppm is from the residual proton signal of the solvent, C6HD5 in C6D6, and the peak at 0.57 ppm is from water, because the solvent has not been dried. This leaves five signals, as predicted above. The methyl group is easy to assign, because its chemical shift is the only peak in the alkane region and this is verified by its integral. There are two peaks with integral 1, the NH and the para-H, one of them very broad, the other looks like a triplet of triplets (tt). Thus it is reasonable to assign the broad signal to the NH proton and the tt to the para-H, because it has two neighboring meta-Hs and two more remote ortho-Hs. Now we have to make up our mind on how to assign the meta- and ortho-Hs. Naively, the ortho-H has one closest neighbor, the meta-H two of them, hence the "doublet" is attributed to the ortho-Hs and the "triplet" to the meta-Hs. I put "doublet" and "triplet" in quotation marks because the symmetry of the spin system renders the o- and m-Hs magnetically non-equivalent and they form higher-order multiplets that look deceptively simple like a first-order doublet and triplet. One indication that things are more complicated turns up if we look closer at the para-H. The field dependence of this multiplet is shown in this figure:

Above, we called it a triplet-of-triplets, but the central triplet shows more, it actually gets more complicated at lower field. The splitting of the outer pair of the center triplet is actually a strong coupling effect: the big coupling of the triplet arises from coupling to the meta protons, they are close in chemical shift. This also causes a "leaning" effect within the multiplet: the high-frequency triplet is clearly higher than the low-frequency triplet.
Another indication that the meta- and ortho-Hs form a higher-order multiplet is featured in the 1H NMR spectrum at 5°C, shown below.

Multiplets of the experimental spectrum are shown in blue, the red trace shows the simulated multiplets using the chemical shifts and coupling constants indicated in the inset with the structural formula (to make the simulation more satisfying, the strong solvent peak has been included). Note that the splitting within the central triplet of the p-H is also reproduced; if the chemical shift of the m-H is changed by 1 ppm to 8.1189 ppm, the splitting disappears and confirms that this is a strong coupling effect. The magnitudes of the 3JHH and 5JHH coupling constants also confirm the assignment of o- and m-Hs.
Now lets investigate the broad NH peak. Usually, broad 1H NMR peaks of OH and NH groups are attributed to exchanging protons, which is often the case for OH protons. However, with NH protons the story can be different because nitrogen has two NMR active isotopes, 14N with spin 1 and 99.63 % natural abundance and 15N with spin 1/2 and 0.37 % natural abundance. Just as protons couple to each other, the same can happen with 14N. However, 14N is a quadrupolar nucleus and, depending on the symmetry at nitrogen, the quadrupolar interaction can be a very efficient contribution to the 14N spin-lattice relaxation time. This fast relaxation can "wash out" the effect of the NH spin-spin coupling (see this page for some examples). How can we decide on the cause of broadening, chemical exchange or coupling to nitrogen? Actually, I selected benzene as solvent because I wanted to reduce the chance of chemical exchange. Nevertheless, there are several experiments that we could use:
(1) If the concentration of the compound is sufficient, there is a good chance that a closer look at the base of the broad peak can reveal the 15N satellites. With the current dilute sample this turned out to be a nice test of the sensitivity of our NMR spectrometers:

With the cryo probe heads, it is easy to find the doublet of 15N satellites flanking the main broad peak, the coupling constant 1J(15N,1H) is 88.6 Hz. With regular probe heads, it is much harder or impossible to identify the satellites. The 500 MHz NMR spectrum results from a triple-resonance probe head, which has the lowest sensitivity due to the third channel (N.B. all spectra were measured using the routine parameter set with 16 scans and comparable parameters). The conclusion is that the 15N satellites are much sharper than the protons facing 14N, therefore exchange is not the culprit because it should affect both isotopologues.
(2) The dilute sample was tailored to provide a sharp 1H NMR spectrum, not for heteronuclear NMR. Nevertheless, here is the 14N{1H} NMR spectrum of this sample, acquired with 324000 scans over night (0.1 s recycle delay):

The broad peak at 132 ppm corresponds to the NH group of acetanilide. The much sharper 14N peak at 310 ppm was baffling initially, until I realized that we purge our probe head with nitrogen gas, i.e. it results from N2. The acetanilide signal has a width of 410 Hz, caused by fast quadrupolar relaxation. From this linewidth, we can estimate the 14N longitudinal relaxation to be T1 = 0.78 ms.
The lineshape of a proton coupled to a quadrupolar nucleus under fast quadrupolar relaxation depends on the relaxation rate and the spin-spin coupling constant. With the relaxation rate of 14N known from the 14N spectrum, this leaves the 1J(14N,1H) as unknown. Simulation of the lineshape using 1J(14N,1H) = 62.7 Hz gives a perfect match to the experimental spectrum:

Actually, 1J(14N,1H) is not really an unknown because we have measured 1J(15N,1H) from the 15N satellites and both coupling constants are related by the ratio of magnetogyric ratios, γ(15N)/γ(14N) = 1.403, giving 1J(14N,1H) = 63.2 Hz. Final proof that the broadness of the NH peak is caused by 14N comes from the 1H{14N} spectrum shown as bottom trace in the figure above. The result of 14N decoupling is not really a sharp peak, because decoupling and relaxation may interfere with each other, both are affecting the life time of 14N spin states, but there is a definite line narrowing.